 Owlhoot AI
Owlhoot Finance Studio
One set of scenario choices.
More useful reporting.
A working prototype for finance teams that prepare recurring management reports and compare Actuals, Budget and Outlook.
Fictional demonstration data. No customer results, quantified savings or production-readiness claims are implied.
See the workflow
From selected data to a finished report.
On-screen captions are included in the demonstration. The public repository contains demonstration media, not the application’s source code.
View the public demo repository →Two report views
Management detail and the full-year outlook.
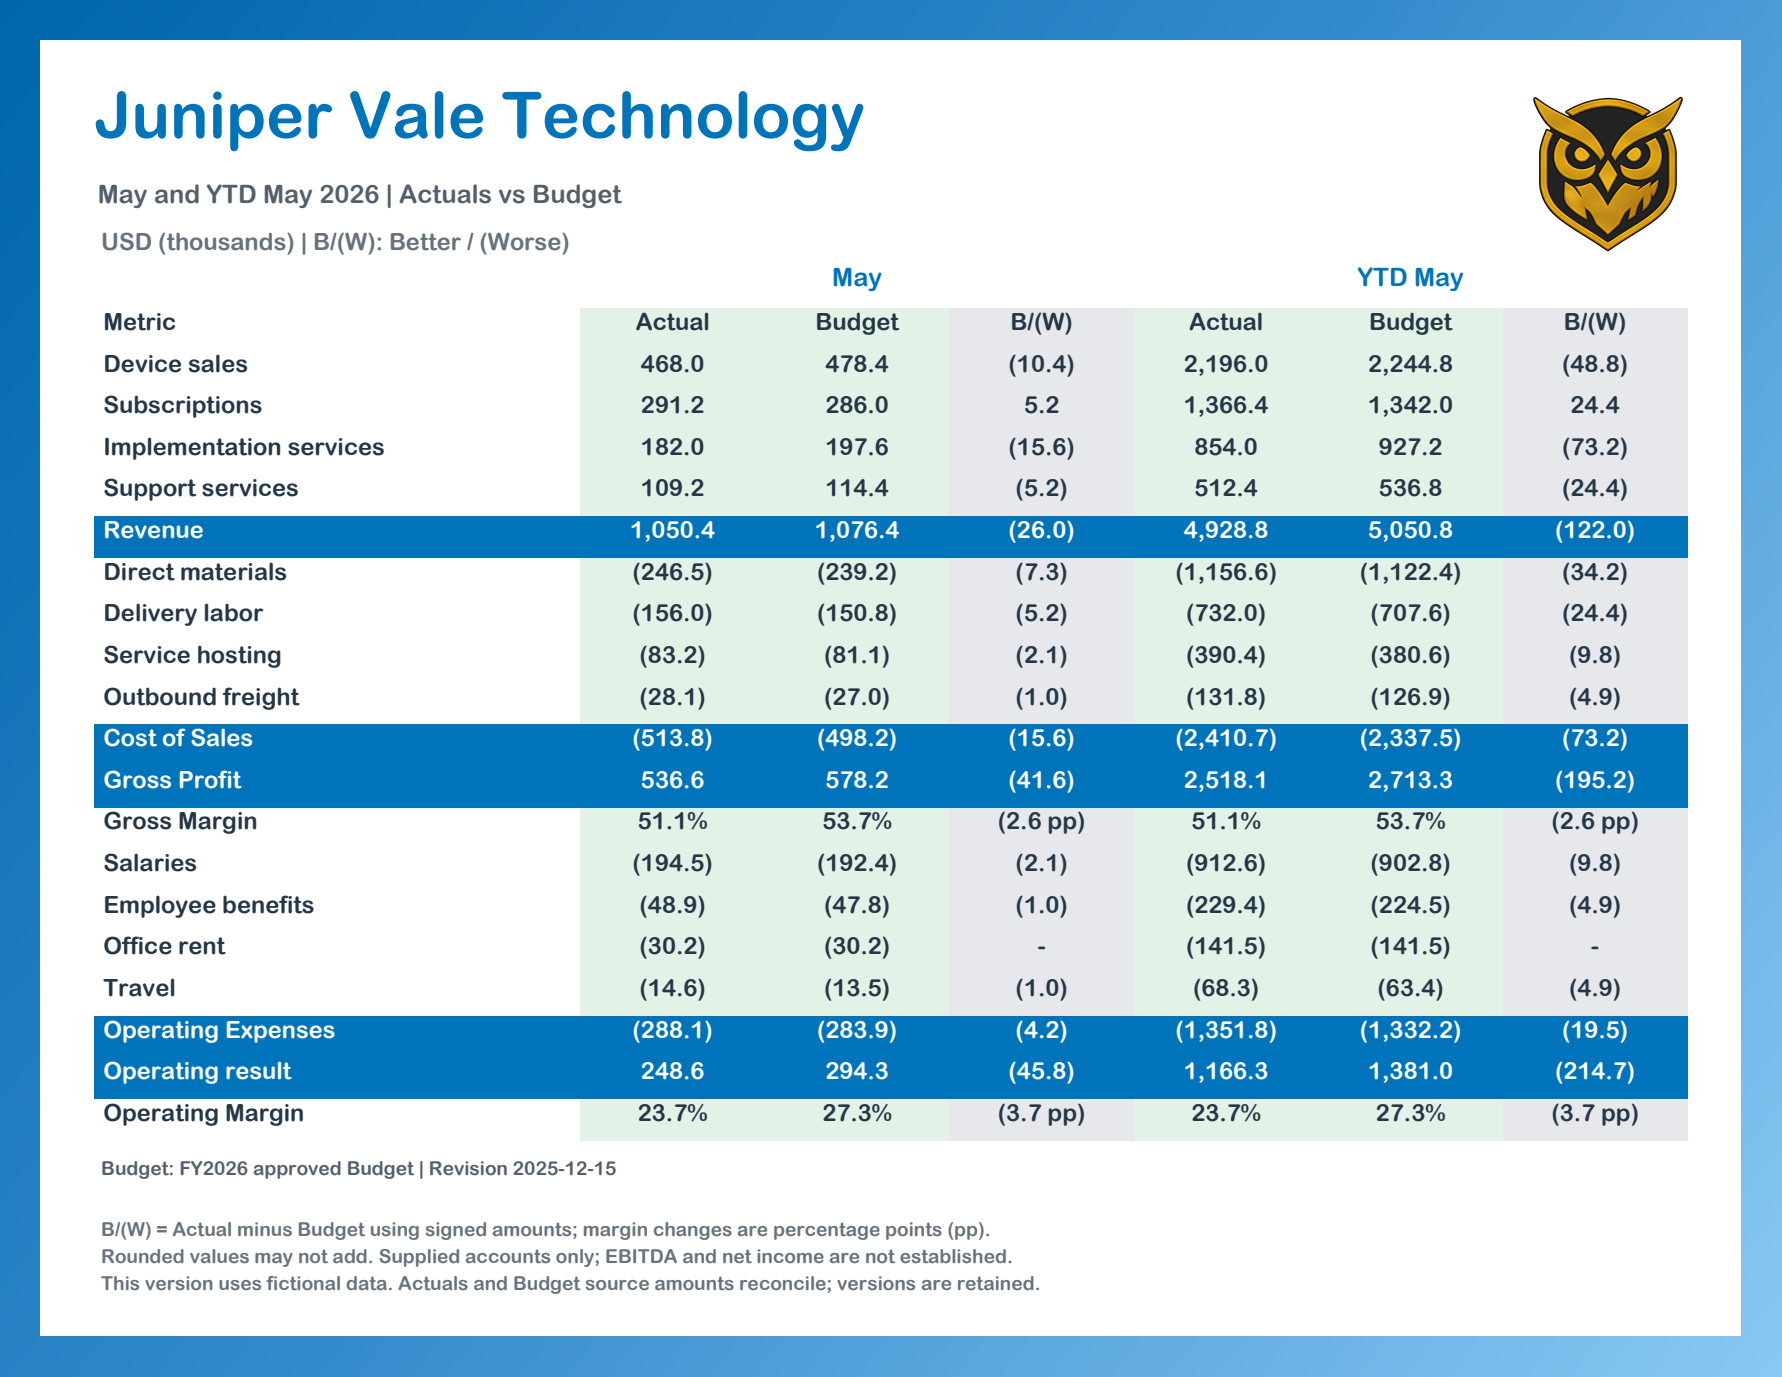
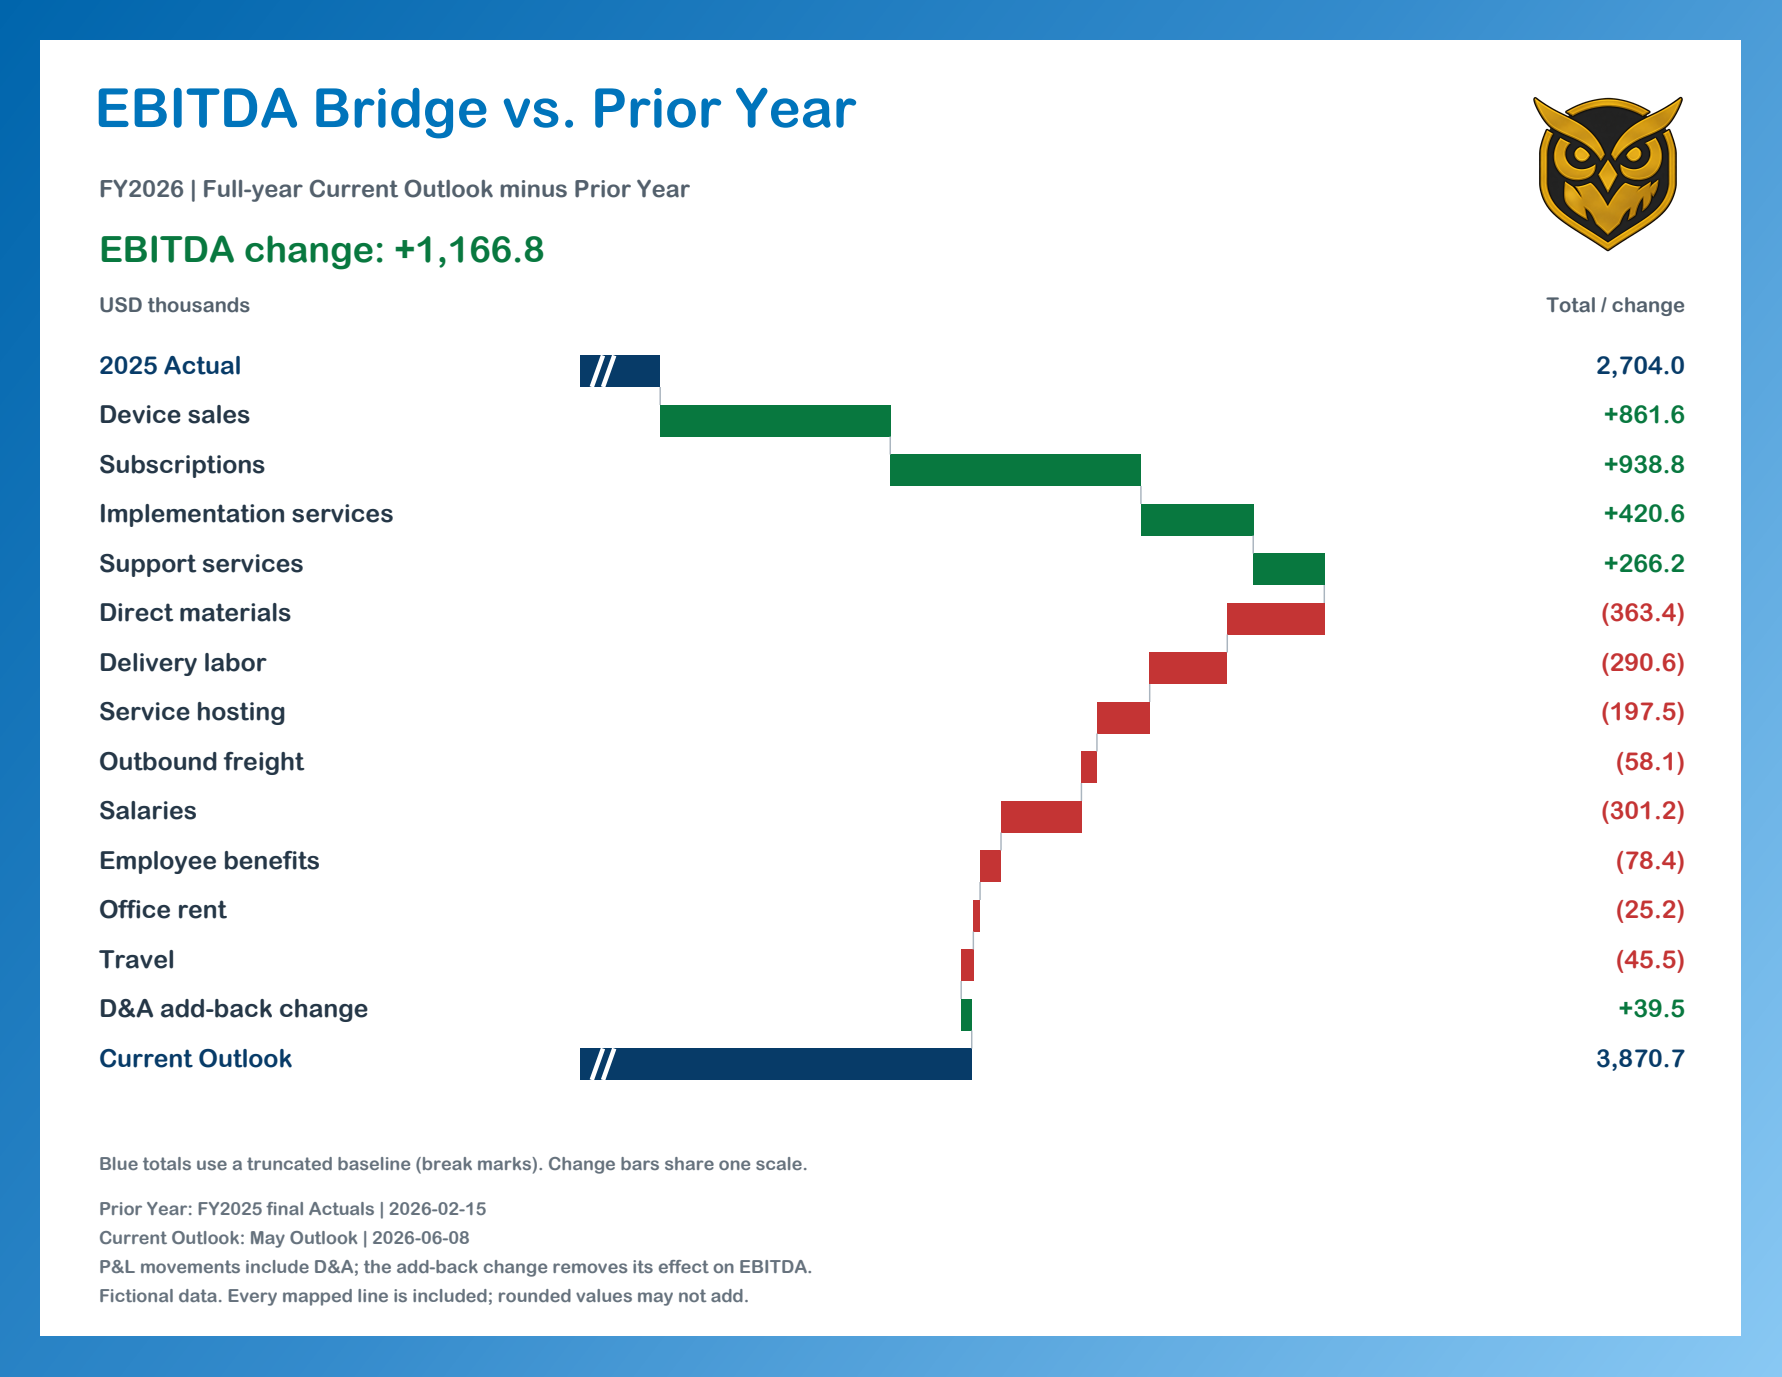
Report exports are available as PDF and editable PowerPoint. Shared corporate costs remain visible separately in the product/service summary.
What the demonstration supports
Clear inputs.
Reusable choices.
Five shared scenario selections
Prior Year Actuals, Current Year Actuals, Budget, Prior Outlook and Current Outlook supply the reports. Select a saved version or upload revised numbers when needed.
A standard Excel input format
Prepare data using the supplied Excel template. Current Year Actuals contain complete year-to-date data through the closed month. Prior Year Actuals, Budget and both Outlook scenarios contain full-year monthly data.
Mapping belongs in Mapping
Review account classifications in the dedicated Mapping page. Saved decisions carry forward; first-time suggestions remain subject to review.
Versions for a recurring close
Upload a revised snapshot when the numbers change. Choose the version to use for a new report; previously created reports retain their original data versions.
What this demonstration does not establish
The demonstration uses fictional USD data and a supported input format. It does not establish compatibility with every ledger, production readiness, customer adoption or quantified savings. AI-generated variance commentary is not part of this demonstration.
Help shape the next practical improvement
Start with the reporting task you need to finish.
I’m interested in where report preparation becomes repetitive, difficult to review or hard to hand over. A short conversation is a better starting point than sending your financial files.
Discuss your reporting workflow →